Monday, August 24, 2009

World Stock Market Round Up : By Nirmal Bang


World Stock MarketsMarket Round Up- The Sensex gained 203 points and closed above the 15K mark. Positive global cues helped the markets to stay on the higher side throughout the day. The NSE Nifty went up 1.35% or 59 points to settle at 4453 after trading in the range of 4492-4394. Today's rally was led by gains in auto, banking, power and IT stocks. The market breadth was positive but the volumes were very lower.

Movers & Shakers

The BSE auto index surged 2.6 %. Maruti, M&M and Hero Honda Motors were the top gainers, up over 3.9 % each.

US stocks gain on possible AIG repayment, economic indicators


US stocks gain on possible AIG repayment, economic indicators New York - US stocks rose sharply Thursday, after ailing insurer American International Group Inc (AIG) suggested it would be repaying its government loans and economic indicators again signalled the recession is easing.

The New York-based Conference Board's index of leading economic indicators rose 0.6 per cent in July, the fourth straigh

Stronger yen drags Tokyo stocks down


Stronger yen drags Tokyo stocks down Tokyo - Tokyo stocks fell Friday as the yen's advance against the US dollar led investors to sell mainly export-oriented issues.

The benchmark Nikkei 225 Stock Average declined 133.1 points, or 1.28 per cent, to 10,250.31.

Automotive shares were among those titles that lost most ground, also affected by the early end of the US "cash for clunkers" car trade-in programme announced for August 24.

US stocks cap strong week as oil tops highest price of 2009


US stocks cap strong week as oil tops highest price of 2009 New York - US stocks rose sharply Friday, capping a positive week of economic and housing sector news, while the price of oil briefly reached a new high for the year.

The Dow Jones Industrial Average rose to its highest level of the year and the Standard and Poor's 500 Index reached its highest point since October.

Home resales surged an unexpected 7.2 per cent in July according to the National Association of Realtors, the best monthly gain in 10 years and a sign that the housing crisis which kicked off the wider recession is ending.

European stocks mark highest closing since early November


European stocks mark highest closing since early November

European Shares traded higher on Friday and managed their highest close since early November. Investor sentiment was lifted by better-than expected U.S. July existing homes sales. The major gainers were the banking stocks.

The closing of the FTSEurofirst 300 index of top European shares came at 2.3 percent at 966.87 points. It should be noted that index apart from being up about 16 percent for the year, has hiked almost 50 percent since reaching a lifetime low in early March.

Nikkei up 3 per cent on hopes of economic recovery, stable politics


Nikkei up 3 per cent on hopes of economic recovery, stable politics Tokyo - Japan's key Nikkei 225 Stock Average surged more than 3 per cent on hopes of economic recovery and political stability at home.

The Nikkei soared 3.12 per cent, or 319.13 points to 10,557.33 during morning trading.

The broader-based Topix index was also up 23.5 points, or 2.48 per cent, at 970.84.

On currency markets at 9 am (0000 GMT), the dollar traded at 94.57-62 yen, up from Friday's 5 pm quote of 93.90-93 yen.

Stock markets are under strong selling pressure: Nirmal Bang Research


Stock markets are under strong selling pressure: Nirmal Bang ResearchThe markets are giving a strong evidence of a intermediate rally if nifty maintain above 4480. As we were mentioning that 4580 is the level to be watched carefully as markets have corrected very sharply from that point. The outlook still remains cautious as the markets have once again given a breakout on the higher side. Now going forward its necessary that nifty maintains above the 4600 level for some time and consolidates before heading for a of 4880.

STOCK IDEA:

BHEL : (2301) Buy with a stop loss of 2248 for a target of 2375

World Market Watch By Nirmal Bang Securities


World Market Watch By Nirmal Bang SecuritiesAsian stocks rose, led by commodities producers, as copper and oil prices increased and sales of existing homes in the U. S. surged the most on record, fueling speculation a global economic recovery is strengthening. BHP added 4.1 % to A$38.11 after copper futures climbed 5.1 % in New York on Aug. 21, the steepest gain since June 1. The MSCI Asia Pacific Index rose 2.1 % to 112.37 as of 10:33 a. m. in Tokyo, with about 14 times as many stocks gaining as retreating. All 10 industry groups climbed, led by materials producers.

Philippine stocks soars 5.11 per cent


Philippine stocks soars 5.11 per cent Manila - Philippine share prices soared 5.11 per cent Monday on expectations that the local economy was on the road to recovery from the global financial crisis.

The 30-share composite index of the Philippine Stock Exchange gained 139 points to close at 2,859.18, from Thursday's finish of 2,720.18. The market was closed last Friday due to a public holiday.

A total of 2.44 billion shares worth 4.21 billion pesos (87.71 million dollars) were traded.

Gainers swamped losers 97 to 18, while 46 issues were unchanged.

Australian stocks follow Wall Street up


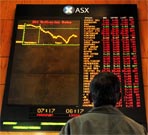
Australian stocks follow Wall Street up Sydney - Australian stocks piled on 3 per cent Monday as investors took their lead from a rise on Wall Street and strong company earnings as the reporting season progresses.

The ASX 200 added 135 points, or 3.1 per cent, to 4,426.

"We've certainly had a very good lead in from Wall Street," CommSec economist Craig James said. "Certainly the analysts had been much too gloomy, and the companies have been very aggressive in terms of cutting costs and supporting the bottom line."

Sensex rises by 289 points in early trade


Sensex rises by 289 points in early tradeMumbai, Aug 24 : The Bombay Stock Exchange’s benchmark 30 share Sensex rose by 289 points in early trade on Monday, extending its gaining streak for the third session in a row.

The increase in the early trade is due to the heavy buying by funds, driven by a firming trend in the global markets.

The Sensex shot up by 289.17 points, to mark 15,530.00 with most of the sectoral indices gaining up to 3.12 per cent. The BSE barometer had gained over 430 points in the past two sessions.

Taiwan stocks close 2.76 per cent higher


Taiwan stocks close 2.76 per cent higher Taipei - Taiwan stocks closed 2.76 per cent higher on Monday, bolstered by a strong rebound in the US, Europe and across Asia, dealers said.

The main TAIEX index opened sharply higher and extended its gains all the way to close at 6,838.25, up 183.45 points, or 2.76 per cent from Friday's trade.

Dealers said prospects of US economic recovery ignited strong buying in the US and the European markets Friday, encouraging Asian stocks to open higher on Monday.

Tokyo stocks edge down on profit-taking


Tokyo stocks edge down on profit-taking Tokyo - The Tokyo market ended morning trading lower Tuesday as investors sold shares to lock in profits from the previous day's gains.

After rising more than 3 per cent Monday, the key Nikkei 225 Stock Average dipped 82.86 points, or 0.78 per cent, to 10,498.19 The broader-based Topix index was also down 5.02 points, or 0.52 per cent, to 965.25.

On currency markets at 9 am (0000 GMT), the dollar traded at 94.39-44 yen, down from Monday's 5 pm quote of 94.95-98 yen.

Market Comments


The risk-seekers wheeled out fresh funds to plow into the market on Friday, with rather predictable results across markets: stocks and commodities up and bonds down. This translated to USD and JPY falling in the currency market, and the commodity currencies, Scandies and Euro catching a bid. While the response is no surprise, it is perhaps worth noting that the response in the USD is weaker than it has been in the past. For example, the S&P500 peaked at around 90 in early June, when EURUSD peaked out around 1.4335. Now we've seen a spectacular 19% rally from the July trough to current levels over 1025 and the EURUSD is trading at about the same level. The more risk-loving AUD has been a stronger performer, but is still up less than 2% above it's June high despite the massive rally in stocks. For Aussie, it is clear that an interruption in the former Chinese equity market parabola on all of the troubling rumblings about a potential Chinese asset bubble and the authorities attempts to deal with it, have dampened enthusiasm somewhat. Still, the bulls are still trying to bid the currency up for new highs versus the market since the mid-August peak and possibly challenge the pivotal 0.8500/20 area.

This week's economic calendar is relatively light. The highlights this week include the US confidence numbers on Tuesday and Friday and the German IFO on Wednesday. Here's a brief run-down of the salient events for the rest of the week:

Tuesday

  • Final Q2 GDP figures from Germany - no change expected to 0.3% QoQ initial reading. Positive growth, but still down over -7% YoY
  • Switzerland SNB's Hildebrand and Jordan to speak
  • US Jun. CaseShiller/S&P500 House Price Index - the data is a bit old for this survey...signs are that prices are stabilizing, but delinquencies are still rising and 30% or more of mortgage holders are under water (owe more than their houses are worth). Any talk of a real housing recovery is impossible.
  • US Aug. Consumer Confidence - one of the real indicators that suggest stock markets should tread carefully. Confidence is still very low - and the average consumer still has a lot of deleveraging to do.
  • US Weekly ABC Consumer Confidence - the most leading of the confidence surveys, though it garners less attention than it should

Wednesday

  • Germany Aug. IFO - much like the US confidence numbers, this important survey, which normally correlates well with the equity indices, has failed to rally anywhere near as much as risk appetite in general, suggesting a disconnect in the real state of expectations and the "supposed" state as expressed in the stock market.
  • US Jul. Durable Goods Orders - a volatile figure, this one has recovered fully after near record breaking weakness during the fall/winter meltdown. The year on year comparisons remind us where we came from however: ex transportation durable goods ran at a -22.2% clip for the June numbers.
  • US Jul. New Home Sales - the disparity between the weak recovery in New Home Sales and the strong bounce in Existing home sales shows that activity in existing home sales has a lot to do with bargain prices and distressed sales and the fed tax credit for first time buyers that expires December 1. New Home Sales are a better indicator of the state of housing.
  • US Crude Oil and Product Supplies - this has become a more interesting number than usual after last week's enormous drop in inventories and with crude oil trading close to the highs for the year. Supplies are still plentiful relative to historic norms.

Thursday

  • New Zealand Jul. Trade Balance - the high-flying kiwi is the country's worst enemy with its reliance on commodity exports, especially with still relatively depressed commodity prices
  • Germany Aug. CPI - no signs of inflation just yet...ECB also more cautious than in cycles past on the prospects for recovery
  • US Q2 GDP - 2nd revision. The US Q2 GDP looked much better - but a lot of that improvement was driven by anemic consumption that brought down import levels. Is reduced trade due to reduced consumption a sustainable path to GDP growth, we ask rhetorically...
  • US Weekly Initial Jobless Claims - last week a disappointment. Another disappointing reading is certainly cause for concern for the bulls, but as we have said - wait till late September to get more significance form these weekly figures.

Friday


  • UK Aug. GfK Consumer Confidence Survey - UK Confidence has bounced about halfway back to where it came from before the crisis.
  • Japan Jul. Jobless Rate, CPI, Household Spending - the big Friday batch of data that arrives in the last week of every month. Markets more interested in upcoming Aug. 30 election and the direction in risk appetite - particularly in the long bond.
  • UK Q2 GDP - 2nd estimate
  • EuroZone Aug. Confidence Data
    Canada Q2 Current Account
  • US Jul. Personal Income/Spending - spending levels are back to unchanged on a month-to-month basis, the moving average in incomes is of more concern - especially with so few still working...
  • US Jul. PCE deflator/core - the core price index is a few tenths of a percent from 50 year lows - are we headed there?
  • US Aug. Final University of Michigan Confidence - the ugly initial reading touched off a brief swoon in risk appetite before it recovered. Confidence matters! President Obama's approval ratings are also weakening, though that could be a symptom of the highly controversial healthcare reform issue.

The pound has traded sharply weaker vs. the Euro - apparently on the continued fall out from the BoE's King and the other two MPC members who also voted for an even large expansion in the asset purchase program. 0.8700 is a critical level in EURGBP. GBPUSD, meanwhile, remains tied up in a tight range.

USDCAD is punching through to new lows today on the strong (if ancient....) retail sales data from June and more importantly the general risk appetite picture and strong rise in oil prices, which are now challenging the highs for the year around 75 dollars a barrel.

Our outlook for the present remains relatively unchanged: the recent action has rejected the bears case for a larger correction lower here in risk appetite and all that entails in a stronger USD and JPY. Nevertheless, recent action has shown that the range may hold if we allow for a bit of slippage. So we could see yet another attempt to new extremes that has been typical of the action both ways (the market trying to get a new move started, only to see that move rejected). We prefer to be on the look out for a reversal at any time rather than boarding the risk train at this time.

Euro Technical Forex Analysis for Forex Traders


Some minor support and resistance levels have developed. A break of those levels is likely to set the tone for the day.

A rise above 1.4360, especially if confirmed by a push above 1.4375, indicates a further move higher. Resistance is expected near 1.4400, 1.4440-1.4450, and by 1.4530.

A drop below 1.4320 will gravitate towards 1.4300. If it holds up well, expect movement back towards 1.4360. Support beyond 1.4300 is 1.4280-1.4270, 1.4200 and 1.4160.

USD / JPY Technical Forex Analysis for Forex Traders


Last week ended with a bullish engulfing pattern (daily chart), indicating stregnth to the upside early this week. The start of trading this week has confirmed this as the rate pushes above recent swing highs.

Target on the upside is 95.20 with some resistance expected in the 95 area.

Minor support is expected at 94.65, 94.35 and 94.20-94.15 on corrections.

U.S. Dollar Finishes Mixed in Lackluster Trading - Forexthound


U.S. Dollar Finishes Mixed in Lackluster Trading - ForexthoundThe lack of fresh economic news kept the Forex markets in check most of the day but the U. S. Dollar did post a gain against most majors. The gains and losses were split between relatively lower yielding European currencies and the higher yielding Pacific Rim currencies.

Saturday, August 22, 2009

Historical exchange rates


Currency units per U.S. dollar, averaged over the year.[31] * = value at start of year.

1970* 1980* 1985* 1990* 1993 1999 2000 2001 2002 2003 2004 2005 2006 2007 2008 As of May 2009
Euro - - - 0.8343 0.8551 0.9387 1.0832 1.1171 1.0578 0.8833 0.8040 0.8033 0.7960 0.7293 0.6791 0.75
Japanese yen 357.6 240.45 250.35 146.25 111.08 113.73 107.80 121.57 125.22 115.94 108.15 110.11 116.31 117.76 103.39 99
Pound sterling 0.4164 0.4484[32] 0.8613[32] 0.6207 0.6660 0.6184 0.6598 0.6946 0.6656 0.6117 0.5456 0.5493 0.5425 0.4995 0.5392 0.66
Renminbi yuan 2.46 1.5 2.7957 4.7339 5.7795 8.2781 8.2784 8.2770 8.2771 8.2772 8.2768 8.1936 7.9723 7.6058 6.9477 7.00
Singapore dollar - - 2.179 1.903 1.6158 1.6951 1.7361 1.7930 1.7908 1.7429 1.6902 1.6639 1.5882 1.5065 1.4140 1.47
Canadian dollar 1.081 1.168 1.321 1.1605 1.2902 1.4858 1.4855 1.5487 1.5704 1.4008 1.3017 1.2115 1.1340 1.0734 1.0660 1.17
Mexican peso (old) - 22.800 206.97 2,679.5 3.1237 9.553 9.459 9.337 9.663 10.793 11.290 10.894 10.906 10.928 11.143 13.23415
Source: Last 4 years 2005-2002 2003-2000 1996-1999 1993-1996 1990 1970-1992 1970-1985 Canada, China, Mexico

Current USD exchange rates

From Currate.com Tools: AUD CAD CHF EUR GBP HKD JPY MXN CNY
From Yahoo! Finance: AUD CAD CHF EUR GBP HKD JPY MXN CNY
From XE.com: AUD CAD CHF EUR GBP HKD JPY MXN CNY
From OANDA.com: AUD CAD CHF EUR GBP HKD JPY MXN CNY

Dollar versus euro


Euro per US dollar 1999-2009
Year
Highest ↑
Lowest ↓
Date Rate Date Rate
1999 03 Dec €0.9985 05 Jan €0.8482
2000 26 Oct €1.2118 06 Jan €0.9626
2001 06 Jul €1.1927 05 Jan €1.0477
2002 28 Jan €1.1658 31 Dec €0.9536
2003 08 Jan €0.9637 31 Dec €0.7918
2004 14 May €0.8473 28 Dec €0.7335
2005 15 Nov €0.8571 03 Jan €0.7404
2006 02 Jan €0.8456 05 Dec €0.7501
2007 12 Jan €0.7756 27 Nov €0.6723
2008 27 Oct €0.8026 15 Jul €0.6254
2009 04 Mar €0.7965 03 Aug €0.6952
Source: Euro exchange rates in USD, ECB
Not long after the introduction of the euro (€ ; ISO 4217 code EUR) as a cash currency in 2002, the dollar began to depreciate steadily in value. As U.S. trade and budget deficits continued to increase, the euro started rising in value. By December 2004, the dollar had fallen to new lows against all major currencies; the euro rose above $1.36/€ (under €0.74/$) for the first time, in contrast to previous lows in early 2003 (€0.87/$). In the first quarter of 2004 the U.S. dollar, with the advantage of Federal Reserve's policy of raising the interest rates, regained some standing against all major currencies, climbing from €0.78/$ to €0.84/$. However, all gains were lost in the second half of 2004, and the dollar stood at €0.74/$ at the end of 2004. Since 2002, the only year in which the dollar actually recovered against the euro was 2005. Although some analysts previewed the dollar dropping as far as $1.60/€ (€0.63/$), it finished 2005 with an increase against the euro, climbing to €0.83/$. An interest rate reduction by the Federal Reserve on September 18, 2007, raised the euro's value significantly and caused the dollar to fall below €0.70 one month later, to new record lows.[28] Economists like Alan Greenspan suggest that another reason for the continued fall of the dollar is its decreasing role as the world's reserve currency. Jim Rogers declared that he thinks the dollar's value will fall even further, especially against the Chinese yuan. Chinese officials signaled plans to diversify the nation's $1.9 trillion reserve in response to a falling U.S. currency which also set the dollar under pressure.[29][30] However, a sharp turnaround occurred in late 2008 with the global financial crisis, with the dollar and Japanese yen rising against most world currencies.

Dollarization and fixed exchange rates


Other nations besides the United States use the U.S. dollar as their official currency, a process known as official dollarization. For instance, Panama has been using the dollar alongside the Panamanian balboa as the legal tender since 1904 at a conversion rate of 1:1. Ecuador (2000), El Salvador (2001), and East Timor (2000) all adopted the currency independently. The former members of the U.S.-administered Trust Territory of the Pacific Islands, which included Palau, the Federated States of Micronesia, and the Marshall Islands, chose not to issue their own currency after becoming independent, having all used the U.S. dollar since 1944. Two British dependencies also use the U.S. dollar: the British Virgin Islands (1959) and Turks and Caicos Islands (1973).

Some countries that have adopted the U.S. dollar issue their own coins: See Ecuadorian centavo coins and East Timor centavo coins.

Some other countries link their currency to U.S. dollar at a fixed exchange rate. The local currencies of Bermuda and the Bahamas can be freely exchanged at a 1:1 ratio for USD. Argentina used a fixed 1:1 exchange rate between the Argentine peso and the U.S. dollar from 1991 until 2002. The currencies of Barbados and Belize are similarly convertible at an approximate 2:1 ratio. In Lebanon, one dollar is equal to 1500 Lebanese pound, and is used inter­changeably with local currency as de facto legal tender. The exchange rate between the Hong Kong dollar and the United States dollar has also been linked since 1983 at HK$7.8/USD, and pataca of Macau, pegged to Hong Kong dollar at MOP1.03/HKD, indirectly linked to the U.S. dollar at roughly MOP8/USD. Several oil-producing Arab countries on the Persian Gulf, including Saudi Arabia, peg their currencies to the dollar, since the dollar is the currency used in the international oil trade.

The People's Republic of China's renminbi was informally and controversially pegged to the dollar in the mid-1990s at ¥ 8.28/USD. Likewise, Malaysia pegged its ringgit at RM3.8/USD in 1997. On July 21, 2005 both countries removed their pegs and adopted managed floats against a basket of currencies. Kuwait did likewise on May 20, 2007,[23] and Syria did likewise in July 2007.[24] However, after three years of slow appreciation, the Chinese yuan has been de facto re-pegged to the dollar since July 2008 at a value of ¥6.83/USD; although no official announcement had been made, the yuan has remained around that value within a narrow band since then, similar to the Hong Kong dollar.

Belarus, on the other hand, pegged its currency, the Belarusian ruble, to a basket of foreign currencies (U.S. dollar, euro and Russian ruble) in 2009.[25]

In some countries such as Peru and Uruguay, the USD is commonly accepted although not officially regarded as a legal tender. In Mexico's border area and major tourist zones, it is accepted as if it were a second legal currency. Some stores near the US border in Canada also accept the U.S. dollar. In Cambodia, US notes circulate freely and are preferred over the Cambodian riel for large purchases,[26][27] with the riel used for change to break 1 USD. After the U.S. invasion of Afghanistan, U.S. dollars are accepted as if it were legal tender. Prices of most big ticket items such as houses and cars are set in U.S. dollars[citation needed].

U.S. Dollar Index


The U.S. Dollar Index (USDX) is the creation of the New York Board of Trade (NYBOT). It was established in 1973 for tracking the value of the USD against a basket of currencies, which, at that time, represented the largest trading partners of the United States. It began with 17 currencies from 17 nations, but the launch of the euro subsumed 12 of these into one, so the USDX tracks only six currencies today.

Currency units per U.S. dollar

Weighting
Euro 57.6%
Japanese yen 13.6%
Pound sterling 11.9%
Canadian dollar 9.1%
Swedish krona 4.2%
Swiss franc 3.6%
Source: NYBOT, " US Dollar Index", pg.3 (PDF)

The Index is described by the NYBOT as "a trade weighted geometric average".[22] The baseline of 100.00 on the USDX was set at its launch in March 1973. This event marks the watershed between the fixed-rate system of the Bretton Woods regime and the floating-rate system of the Smithsonian regime. Since then, the USDX has climbed as high as the 160s and drifted as low as the 70s.

The USDX has not been updated to reflect new trading realities in the global economy, where the bulk of trade has shifted strongly towards new partners like China and Mexico and oil-exporting countries while the United States has de-industrialized.

DOLLARS


A Message from our President

March will be our last meeting of the year. We have had only 15 renewals and the board decided to suspend operation for the rest of the year. The Oakland REIA has started a group for advanced investors and I am encouraging all DOLLARS members who want to meet with experienced investors to give the Oakland Group a try. They are just starting up their advanced sub group so in all fairness we should give them a couple months and see if it is a forum that our members enjoy. Since DOLLARS is suspending they will be meeting on the 3rd Thursday of the month. Check out their web site at REIA of Oakland.com.

I want to remind everyone of the Institute of Real Estate Management Annual Trade Show on March 18th. It is held at the Burton Manor on Schoolcraft in Livonia. It is a good place to find vendors that cater to the rental property business. The show is free.

Our meeting this month will be an open format. This is the time to get your questions answered by the other attendees. I want to hear from all as to what worked and didn’t work for you last year, what you learned from last years experiences, what problems you arJustify Fulle having now, and what course of action you are taking now. The open format meetings are where we learn the most.

File:USDnotes.png

Monday, August 17, 2009

Euro Gains Against Dollar, Yen Before German Confidence Report


The euro rose for the first time in three days against the dollar before a report forecast to show German investor confidence improved this month, easing concern the global economic recovery will stall.

The 16-nation currency gained the most in more than a week versus the yen as economists estimated sentiment climbed to a three-year high in Europe’s largest economy. The yen fell against all 16 major counterparts on speculation Japanese importers took advantage of its strength to sell the currency. The dollar ended two days of gains versus Australia’s currency before a U.S. report forecast to show July housing starts rose.

“Because Germany is a manufacturing hub, it’s a good barometer for what’s happening in the global economy,” said Jonathan Cavenagh, a currency strategist at Westpac Banking Corp. in Sydney. “The euro will receive some benefit from it.”

The euro rose to $1.4115 at 6:58 a.m. in London from $1.4082 in New York yesterday, when it touched $1.4046, the lowest level since July 30. It advanced 0.7 percent, the most since Aug. 7, to 134.05 yen from 133.08 yen. The euro bought 86.16 British pence from 86.15 pence.

The yen weakened to 94.96 per dollar from 94.50 in New York yesterday, when it reached 94.21, the strongest level since July 29. The currency dropped 0.9 percent to 78.27 versus Australia’s dollar and fell 0.8 percent to 63.62 for each New Zealand dollar.

Germany’s Economy

Europe’s single currency rebounded from a two-day decline versus the U.S. dollar as doubts eased about the economic recovery in the 16-nation area.

The ZEW Center for European Economic Research will say its index of investor and analyst expectations rose to 45 from 39.5 in July, according to the median of 35 forecasts in a Bloomberg News survey. That would be the highest reading since May 2006. ZEW releases the report, which aims to predict developments six months ahead, at 11 a.m. in Mannheim today.

Germany’s economy grew 0.3 percent in the second quarter from the first, bringing a halt to the worst recession since World War II sooner than forecasters had expected, a report showed last week.

The European Central Bank this month kept its benchmark interest rate unchanged at 1 percent. ECB President Jean-Claude Trichet said after the Aug. 6 meeting that there are “clearly less negative” economic signs.

The yen declined from near a two-week high versus the dollar on speculation Japanese importers sold the currency and as technical charts signaled its 1.2 percent gain in the past five days was excessive.

Yen Correction

“The yen’s recent rise was rapid, so there’s probably a correction occurring,” said Nobuaki Kubo, vice president of foreign exchange in Tokyo at BBH Investment Services Inc., a unit of New York-based Brown Brothers Harriman & Co. “It’s also likely that importers would sell yen at these levels.”

The dollar’s 14-day stochastic oscillator against the yen was at 12.9 yesterday, below the 20 threshold that indicates an asset price may have fallen too fast and is poised to gain. In technical analysis, investors and analysts study charts of trading patterns and prices to forecast changes in an asset’s value.

Japan’s currency also weakened amid speculation investors sold the yen to purchase higher-yielding assets elsewhere.

“There’s talk that Japanese insurers and securities firms are selling the yen,” said Takashi Kudo, director of foreign- exchange sales at NTT SmartTrade Inc., a unit of Nippon Telegraph & Telephone Corp. “They may be seeking higher returns abroad.”

China Stocks

The benchmark interest rate is 0.1 percent in Japan, compared with 3 percent in Australia and 2.5 percent in New Zealand, making the South Pacific nations’ assets attractive to investors.

Losses in the yen were limited as a drop in China’s stocks boosted demand for the currency as a refuge.

The Shanghai Composite Index, which tracks the bigger of China’s stock exchanges, dropped 0.3 percent, extending its losing streak into a third day. The index has declined 18 percent from this year’s high on Aug. 4 on concern a slump in exports and new loans will hamper economic growth.

“Falling stocks in China are the only reason” the yen is being bought as a refuge, said Akira Hoshino, chief manager of the foreign-exchange trading department in Tokyo at Bank of Tokyo-Mitsubishi UFJ Ltd., a unit of Japan’s largest lender by market value. “It’s hard to estimate when stocks will reach a bottom, as they’ve been sold consistently.”

U.S. Housing Starts

The U.S. dollar fell 0.5 percent to 82.47 cents per the Australian dollar before the Commerce Department reports housing data today in Washington. U.S. housing starts rose to an annual rate of 598,000, the highest level since November, from a 582,000 pace in June, a Bloomberg survey showed.

“A positive number will add to signs the U.S. housing market is bottoming out,” said Masashi Hashimoto, a senior analyst at Bank of Tokyo-Mitsubishi UFJ Ltd. “That could cause the euro to be bought, leading to a drop in the dollar and the yen in the short-term.”

The Dollar Index, which the ICE uses to track the dollar against currencies of six major U.S. trading partners such as the euro and the yen, declined to 79.175 from 79.318 yesterday.

FOREX-Yen retreats as stocks offer risk trades respite


The yen fell on Tuesday, snapping back from its highest levels this month against the dollar and euro and retreating against commodity-linked currencies as Asian share markets steadied after losses.

Eyes were on stock markets after Monday's volatile session in which shares in Shanghai .SSEC lost 5.8 percent and currencies associated with risk-trades, such as the Australian and New Zealand dollars, shed more than 1 percent.

The euro, Aussie and kiwi dollars all rose about half a percent against the Japanese currency and clawed back some lost ground against the dollar as investors covered short positions built in the sell-off the previous day, dealers said.

"Gains in yen crosses today were a recovery from excessive losses the previous day, rather than investors being actively engaged in risk trading," said Ayako Sera, a market strategist at Sumitomo Trust & Banking.

The dollar rose 0.4 percent from late U.S. trade to 94.88 JPY=, after dipping to its lowest in nearly three weeks on Monday at 94.19 yen

FOREX-Yen slips as risk currencies win respite


The euro climbed 0.5 percent to 133.77 yen EURJPY=R after touching its lowest in nearly a month at 132.51 yen on Monday. Against the dollar it rose 0.2 percent to $1.4103 EUR=.

The Australian dollar rose 0.3 percent to $0.8228 AUD=D4 after falling more than 1.3 percent the previous day. Last Friday the Aussie hit an 11-month high of $0.8479.

Against the yen, it advanced 0.6 percent to 78.05 yen AUDJPY=R after losing nearly 2 percent on Monday.

It dipped briefly after minutes from the Australian central bank's latest board meeting showed policy-makers were concerned that the strength of household demand could prove temporary, particularly if it tightened too early. [ID:nSYC000233]

Asian stock markets seesawed after sharp falls on Monday but dropped into the red as the day wore on.

Markets have been watching China closely to gauge how far it can help economies emerge from recession while the turnaround in the United States takes time, and the closedly watched Shanghai Composite index .SSEC was volatile, edging up later.

"Everyone knows it's no wonder Chinese shares need a correction as they have risen sharply," said Kosuke Hanao, head of treasury products sales at HSBC.

"But the point is whether their current fall will be within a correction in the bull market or not."

The Shanghai index is up more than 50 percent since the start of the year but has shed about 18 percent after hitting a 14-month high two weeks ago

Technical Major Currencies Morning Report


EUR/USD

EUR/USD
Since the pair breached 1.4110 to the downside, the confirmation was provided for the classical bearish pattern, shown in the side image above. This technical pattern targets 100% extension at 1.3965 levels, where we see the pair now retesting the breached neckline for this pattern. The descending channel that pattern has constructed, with its resistance level at 1.4275, will keep the downside wave valid as far as trading is intact below it, also affected by the 50 MA at 1.4230. Thus, today’s headings are to the downside but stochastic is showing the pair is attempting to move to the upside, yet if that was seen it will only be a correctional move to gather more bearish momentum to continue the move to the downside.

The trading range for today is among the key support at 1.3840 and the key resistance at 1.4460.

The general trend is to the downside as far as 1.4720 remains intact with targets at 1.2120.

Support : 1.4070 1.4020 1.3990 1.3965 1.3930
Resistance : 1.4110 1.4185 1.4230 1.4275 1.4315


Recommendation : Based on the charts and explanations above our opinion is selling the pair from 1.4100 To 1.3965 and stop loss above 1.4185, might be appropriate.

GBP/USD

GBP/USD
The pair continues to trade bearishly affected by the negative pattern and the construction of a descending channel over intraday basis, where its resistance is seen at 1.6500, associated with the 20 MA at level 1.6480. The pair now is retesting the resistance level and the neckline, for the pattern shown in the image above, to unload some momentum as the pair is trading in oversold areas; nevertheless, we are sticking to the classical analysis and the negative crossover on MACD, where we expect the pair to move to the downside over intraday basis, without ruling out the possibility for some upside corrections. The 1.6600 levels need to remain intact to preserve our bearish outlook for the pair.

The trading range for today is among the key support at 1.5970 and the key resistance at 1.6750.

The general trend is to the upside as far as 1.4840 remains intact with targets at 1.7100.


Support : 1.6305 1.6285 1.6225 1.6180 1.6020
Resistance : 1.6390 1.6480 1.6500 1.6565 1.6600


Recommendation : Based on the charts and explanations above our opinion is selling the pair from 1.6390 To 1.6220 and stop loss above 1.6500, might be appropriate.

USD/JPY

USD/JPY
The pair resumed trading above 50% correction after gaining enough upside momentum from the previous 61.8% correction level at 94.10; where we can see the pair heading towards retesting previously breached support levels which have now become strong resistance levels. Momentum indicators are assuring the expected upside correction, where ADX is losing its downside strength with the possibility of forming a weak upside direction. All these signs are making us favor the upside correctional move for today which will prevail as long as 94.10 remains intact. Nevertheless, this upside move is merely correctional for the pair to gather more downside momentum to resume the bearish short term wave.

The trading range for today is among the key support at 92.10 and the key resistance at 96.85.

The general trend is to the upside as far as 102.60 remains intact with targets at 84.95 and 82.60.


Support : 94.10 93.70 93.15 92.75 92.10
Resistance : 95.10 95.10 96.00 96.85 97.25

Growth in "Potential GDP" Shows Limited Potential


Historically, two factors have made important contributions to stock market returns in the years following U.S. recessions. One of these that we review frequently is valuation. Very simply, depressed valuations have historically been predictably followed by above-average total returns over the following 7-10 year period (though not necessarily over very short periods of time), while elevated valuations have been predictably followed by below-average total returns.

Thus, when we look at the dividend yield of the S&P 500 at the end of U.S. recessions since 1940, we find that the average yield has been about 4.25% (the yield at the market's low was invariably even higher).
Presently, the dividend yield on the S&P 500 is about half that, at 2.14%, placing the S&P 500 price/dividend ratio at about double the level that is normally seen at the end of U.S. recessions (even presuming the recession is in fact ending, of which I remain doubtful). At the March low, the yield on the S&P 500 didn't even crack 3.65%. Similarly, the price-to-revenue ratio on the S&P 500 at the end of recessions has been about 40% lower than it is today, and has been lower still at the actual bear market trough. The same is true of valuations in relation to normalized earnings, even though the market looked reasonably cheap in March based on the ratio of the S&P 500 to 2007 peak earnings (which were driven by profit margins about 50% above the historical norm).

Stocks are currently overvalued, which – if the recession is indeed over – makes the present situation an outlier. Unfortunately, since valuations and subsequent returns go hand in hand, the likelihood is that the probable returns over the coming years will also be a disappointingly low outlier. In short, we should not assume, even if the recession is ending, that above average multi-year returns will follow.

That conclusion is also supported by another driver of market returns in the years following U.S. recessions: prospective GDP growth. Every quarter, the U.S. Department of Commerce releases an estimate of what is known as "potential GDP," as well as estimates of future potential GDP for the decade ahead. These estimates are based on the U.S. capital stock, projected labor force growth, population trends, productivity, and other variables. As the Commerce Department notes, potential GDP isn't a ceiling on output, but is instead a measure of maximum sustainable output.

The comparison between actual and potential GDP is frequently referred to as the "output gap." Generally, U.S. recessions have created a significant output gap, as the recent one has done. Combined with demographic factors like strong expected labor force growth, this output gap has resulted in above-average real GDP growth in the years following the recession.

The chart below shows the 10-year growth rates in actual and potential GDP since 1949 (the first year that data are available).

Ten year Growth

The blue line presents actual growth in real U.S. GDP in the decade following each point in time. This line ends a decade ago for obvious reasons. The red line presents the 10-year projected growth of "potential" real GDP. This line is much smoother, because the measure of potential GDP is not concerned with fluctuations in economic growth, only the amount of output that the economy is capable of producing at relatively full utilization of resources.

One of the things to notice immediately is that because of demographics and other factors, projected 10-year growth in potential GDP has never been lower. This is not based on credit conditions or other prevailing concerns related to the recent economic downturn. Rather, it is a structural feature of the U.S. economy here, and has important implications for the sort of economic growth we should expect in the decade ahead.

The green line is something of a hybrid of the two data series. Here, I've calculated the 10-year GDP growth that would result if the current level of GDP at any given time was to grow to the level of potential GDP projected for the following decade. This line takes the "output gap" into effect, since a depressed current level of GDP requires greater subsequent growth to achieve future potential GDP. Notice here that even given the decline we saw in GDP last year, the likely growth in GDP over the coming decade is well under 3% annually - a level that we have typically seen in periods of tight capacity (that were predictably followed by sub-par subsequent economic growth), not at the beginning stages of a recovery.

The situation is clearly better than it was at the 2007 economic peak, where probable 10-year economic growth dropped to the lowest level in the recorded data, but again, the likely growth rate is still below 3% annually over the next decade even given the economic slack we observe.

Aside from a gradual recovery of the "output gap" created by the current downturn, there is no structural reason to expect economic growth to be a major driver of investment returns in the years ahead. With valuations now elevated above historical norms, there is no reason to expect strong total returns on an investment basis either.

The primary element that is favorable at present is speculation – excitement over the prospect that the recession is over. Investors are presently anticipating the good things that have historically accompanied the end of recessions (strong investment returns and sustained economic growth), without having in hand the factors that have made those things possible (excellent valuations and a large output gap coupled with strong structural growth in potential GDP).

Growth in Potential GDP


This week I offer you two short pieces for your Outside the Box Reading Pleasure. The first is from my friends at GaveKal and is part of their daily letter. They address the real difference between those who think we will have a consumer led recovery (Keynesian) and those who think we will have a corporate profit led recovery (classical economics or Schumpeterian). This is actually a very important debate and distinction.

We are hearing concerns, from some clients and friends, that the brutal corporate cost-cutting seen in the wake of the subprime crisis will delay the recovery, because this trend is killing the US consumer. In other words, how can one spend if he has lost his job or fears as much, or has seen his work hours drastically reduced, taken a pay cut, or expects his company pension system is about to implode? For us, this all boils down to a crucial question: do we need consumption to pick up in order to achieve a rebound in growth? The answer to this question very much depends on whether one accepts a Keynesian view of the economic process, or a Schumpeterian (or classical) view. We hope our readers forgive us, but we are now going to have to get a tad theoretical....

  • In a Keynesian view, consumption is the motor of growth. If companies slash their payrolls, consumption contracts and we enter into a vicious cycle in which the subsequent decline in demand leads to a second wave of cuts, which then leads to a further decline in consumption, and so on and so forth. The Keynesian cycle may have been useful from 1945 to 1990, but in the past 20 years, globalization and just-in-time technologies have changed the nature of corporate management, which is why we believe a classical, capital-spending led view of the economic cycle will reassert itself.

  • In a classical view, as exemplified by "Say's law" and reinforced by Schumpeter, corporate profitability is the cause, not the consequence, of economic growth. Thus, Schumpeter would see the current cycle as the destruction phase in the creative-destruction processes that propel the economic cycle. Capital and labor are currently moving from the sectors in decline (e.g., McMansions) to the sectors in expansion (e.g., tech, alternative-energy infrastructure, etc.). Once momentum in the growth sectors overwhelm the decaying ones, then macro growth resumes. Under this framework, consumption kicks in at the end of the cycle (for more on this, see the very first paper published by GaveKal, Theoretical Framework for the Analysis of a Deflationary Book).

Within our firm, Charles is the major proponent of the Schumpeterian view, and this thinking was apparent in his and Steve's recent ad hoc, A V-Shaped Recovery in Profits. Due to the quick reflexes that new technologies allow, corporates are managing their cash flow better than ever. Rarely ever, for instance, have companies (ex-financials) remained in such strong positions during a recession, which is yet another reason why we believe that capital spending, rather than consumption, will spark the recovery.

Indeed, the scale at which corporates have been able to cut costs and return to profitability, has laid the groundwork for a deflationary boom of epic proportions (which would be a major surprise for those who fear an easy-money inflationary nightmare). Of course, there is a major threat to this deflationary-boom scenario-and that is the increased government intervention we are seeing in most corners of the world. If government intervention manages to kill off return on investment capital, as it did in the 1930s, then the current opportunity will go up in smoke. Regular readers know we tend to err on the side of optimism; at this point we still hold out hope that a major lurch to a big-government era can be resisted-as exemplified, for example, by the unexpectedly strong fight we are seeing against the health-care bill, or the ability of so many US financials to pay back their debt to the US Treasury, thus lowering the extent of government influence on their business decisions. Thus, in our view, a period of deflationary boom is the likeliest scenario, and investors should focus on sectors and countries that will see the largest resurgence in capital spending.


Monday Morning Meltdown.


Where did all the economic optimism go? Just a week ago we were celebrating the end of the recession and now we look like we are running for cover. Banks have been failing like crazy yet the Colonial Bank failure late Friday afternoon, on top of sinking consumer confidence and retail sales, was a reminder that while the economy is on the mend we still have some significant problems ahead.

Weak demand for oil and ample supply in storage means that oil is less concerned with the three storms that have developed in the Atlantic. With global spare production capacity at the ready and lessons learned from past hurricanes, the market at this point is less concerned about the hurricane threats than it has been in the past. Of course at the same time these storms may not be a threat to oil production anyway. Ana, Bill and Claudette are the names of these storms. Claudette is a tropical storm that has already hit the Florida coast. The National Hurricane Center says that the center of Claudette was 25 miles west of Panama City, Florida, at 10 p.m. Central Daylight Time, the center said.
The storm was moving northwest at 12 mph with winds of about 50 mph, the latest advisory said.
Claudette has not impacted any oil or gas production in the Gulf.

Ana is a tropical depression whose current track going up the gulf side of the Florida coast whose track theoretically could and may be more of a threat to oil production but that really depends on the strength of the storm which at this time though uncertain seems to be less of a threat. The National Hurricane center says that Ana is moving at an uncertain but fast track. The storm is tightly clustered for the next 36 hours or so and in is expected that Ana will move over Hispaniola. Then the storm’s, “dynamical guidance will weaken and bring the remnants toward the eastern Gulf of Mexico or Florida.” But it is possible that the storm may fizzle out over Hispaniola and not become an issue.

Then there is Hurricane Bill that looks like it will go up the East-Coast and miss the key oil producing Gulf completely. Though the storm could change direction the market seems like it will not become an issue.

So if the storms are not an issue then the economy will be. Stocks are concerned about more bank failures and the fact that Japan’s economy grew less than estimated. Stocks in Asia and Europe fell as the US dropped last week. As far as an important indicator of future energy demand, traders may focus on the Federal Reserve Bank of New York’s Empire State Index. Traders are looking for the first expansion in New York manufacturing in a year and if they do not get it, the energy complex may feel the brunt of the disappointment.

Start your week off right by getting the latest breaking business news on the Fox Business Network where you can see me every day. And it might be time for you to trade! If you are ready call me at 800-935-6487 or email at Pflynn@pfgbest.com. Call for intraday entry and exits! See all the services that PFGBest can offer you. Metals, Forex, managed accounts you name it!

We're short Sept crude from apprx 7150 – lower stop to 7050!

Sell September heating oil 19300 - stop 19700.

Sell September RBOB 20550 –lower stop 20900.

Sell September natural gas at 470 - stop 480.

Economic Indicators Review


Canada – Housing starts in Canada dropped to 132.1K (-4.1%) in July after rising two straight months. Single-family units dipped to 52.5K from 53.1K while multifamily units slid to 61K from 67K. The sharpest declines were observed in Ontario (-6.7K) and Alberta (-2.4K). Quebec posted the biggest gains (+6.3K). Importantly, the 3-month moving average ceased falling and is currently at a 4-month high.

Canadian Housing Starts

The Canadian trade balance registered a slim $55-million deficit in June, down from a $1.0-billion deficit in May. Exports rose $0.7 billion or 2.3%, driven by energy products (+$0.8 billion) and industrial goods and materials (+$0.4 billion). This was partially offset by declines in machinery and equipment and automotive products.
Imports sagged $0.4 billion, owing mostly to machinery and equipment (-$0.5 billion) and industrial goods and materials (-$0.3 billion). In real terms, the trade deficit shrank $0.5 billion to $4.5 billion thanks to an 11% increase in energy exports.

Manufacturing shipments outdid expectations in June with a 1.9% rise, 80% of which was due to the aerospace products sector, where sales rebounded (+61%) from an abnormally low level the previous month. The record surge on the month of 20.5% in the volume of new orders was particularly impressive.

United States – Productivity in Q2 jumped 6.4%, surpassing the consensus estimate of 5.5%. Unit labor costs diminished 5.8% while hourly compensation climbed 0.2%.

The U.S. trade deficit rose from $26.0 billion to $27.0 billion in June, short of the consensus estimate of $28.7 billion. The swell was due to a $3.9-billion increase in the petroleum deficit, driven by higher oil prices. The deficit excluding petroleum retreated from $12.7 billion to $9.8 billion, an 11-year low.

The FOMC kept its target range for the Fed funds rate unchanged this week at 0% to 0.25%. The Fed clarified its plans for the Fed Treasury purchases: Only the $300 billion previously committed will be spent and the program will expire by the end of October. In our opinion, the target range will need to be adjusted upward, possibly by yearend, for the sake of the Fed’s balance sheet.

U.S. retail sales flagged 0.1% in July, for a first setback in three months. However, the underlying trend is not as bad as this might suggest. Sales excluding gas stations and grocery stores, a better indicator of consumer discretionary spending, were actually up 0.2% for a third monthly increase in a row.

U.S. headline CPI was flat in July while core CPI rose 0.1%. Year-over-year headline CPI slipped to -2.1% from - 1.4% while core inflation slowed to 1.5% from 1.7% a month earlier. However, the year-over-year headline CPI has now probably reached its trough: Price momentum has shifted upward, as evidenced by the annualized 6-month rate of change back in positive territory.

Ratio call spread suggests bullish sentiment on Cabot Oil & Gas


COG – Cabot Oil & Gas Corp. – The oil and gas company appeared on our ‘hot by options volume’ market scanner after a ratio call spread was established in the September contract. Broad market declines did not spare COG today as shares fell nearly 4% to stand to the current price of $33.75. The bullish investor responsible for the spread looked to the deep in-the-money September 30 strike price to purchase 3,000 calls for an average premium of 4.15 apiece. The long calls were marked against the short sale of 6,000 calls at the higher September 35 strike for 1.15 per contract. Thus, the net cost of the spread amounts to 1.85 and yields maximum potential profits of 3.15 if COG rallies up to $35.00 by expiration next month. The investor has already realized profits on the transaction because shares are currently higher than the breakeven point at $31.85. But, the ratio of 2 short calls for each long call leaves the trader vulnerable to potentially unlimited losses in the event that shares of COG surge higher than $38.15 by expiration.

HPQ – Hewlett-Packard Co. – The global technology company has experienced a more than 1.5% decline in shares today to $43.26 ahead of its third-quarter earnings release, which is scheduled to follow the closing bell on Tuesday afternoon. At least one investor was seen bracing for bad news or at least for continued declines in the price of the underlying. The trader established a ratio put position by purchasing 5,000 puts at the August 42.5 strike for approximately 89 cents apiece, spread against the sale of 10,000 puts at the lower August 40 strike for 25 cents per contract. The net cost of the bearish transaction amounts to 39 cents and yields maximum potential profits of 2.11 if the stock slips to $40.00 by expiration this Friday. Shares must fall about 3% from the current price in order for the trader to begin to amass profits beneath the breakeven point at $42.11. Maximum profits of $1,055,000 will be retained by the investor if the stock falls to $40.00 and the lower strike puts remain out-of-the-money. If shares were to slip lower than $40.00, the trader may have shares of the underlying put to him at expiration given the ratio of 2 short put options to each long contract in his possession. Investor uncertainty has marched steadily higher throughout the day from 33% this morning to the current reading of 37% -- a sign of building tension ahead of the firm’s third-quarter profit report.

ALGN – Align Technology, Inc. – Investors in the maker of the Invisalign system are surely all smiles today as shares have exploded more than 30.5% higher to $13.20. The manufacturer of Invisalign, which is a proprietary method for correcting the misalignment of teeth, has nearly breached its 52-week high of $13.74 on today’s rally. Positive news regarding a settlement over patent litigation involving ALGN and Danaher Corp.’s Ormco unit, prompted one analyst at Northcoast Research to raise the stock to ‘neutral’ from ‘sell’. Bullish traders, hoping for continued gains in the stock, purchased approximately 1,000 calls at the September 15 strike price for an average premium of 23 cents apiece. Shares of ALGN must climb an additional 15% in order for call-buyers to begin to amass profits at the breakeven price of $15.23. Additional near-term optimism was observed at the August 10 strike price where traders shed 1,000 puts for 21 cents each. Other investors appeared to be banking gains on the rally by selling about 2,000 calls at the now in-the-money August 12.5 strike for a premium of about 80 cents. We note that 15,656 option contracts exchanged hands on Align Technology during the trading session, which comprises more than 53% of the existing open interest on the stock of 29,119 lots.


FOREX NEWS Copyright © 2008 Green Scrapbook Diary Designed by SimplyWP | Made free by Scrapbooking Software | Bloggerized by Ipiet Notez